
10 Must-Know YouTube Engagement Metrics To Check Back On
You are here because you want to know key YouTube engagement metrics to grow your channel and rank videos higher, right?
Whether you are a marketer or vlogger, YouTube is your favorite playground for live streaming and audience reach. Not surprisingly, its free video hosting with unlimited bandwidth, 2 billion users, and detailed YouTube Analytics are bound to meet your needs.
Speaking of Analytics, marketers err on the side of caution tracking many metrix with little results, while vloggers often focus on content. Either way, the secret behind YouTuber’s success is the middle ground.
In this post, we will discuss 10 important YouTube engagement metrics every creator should know. Just 10 key stats to check back on to neither overwork your marketing efforts nor compromise on engagement.
YouTube Engagement Metrics – Audience Insights
How users react to your videos appearing in their feed? Do they click on your thumbnail or scroll past it? Which countries your viewers come from? Which devices do they use to access YouTube? Checking impressions and CTR together with traffic sources gives you insights into how videos get discovered.
#1 Impressions and CTR
Impressions and CTR (click-through-rate) are the key indicators of how well optimized a video title and thumbnail are. Simply put, impressions is the number of people seeing your video thumbnail in their feed, and CTR is the percentage of that number who clicked on to watch your upload.
While there is no exact number for good CTR or impressions, it is clear that these YouTube Engagement metrics correlate with each other. Naturally, a video with hundreds of thousands of impressions decreases its CTR. Also, “Half of all channels and videos on YouTube have an impressions CTR that can range between 2% and 10%”, states the platform on its Help page.
#2 Traffic Sources
It is not a big break, right? To get insights about your traffic select the Reach tab at the top of the Analytics page, and click on the Traffic Source Types report.
You will see 4 major types: YouTube Search, External (outside YouTube platform), Suggested Videos and Playlists. Each discovery metric shows you where you’ve messed up, and how YouTube engagement can be improved.
If your video gets the most views and impressions through Suggested Videos rather than YouTube search, your videos may match the interests of viewers but lack search optimization. Because YouTube has different algorithms for searched and Suggested content, it is easier for new creators with fewer subscribers to see views coming from Suggested videos rather than search results, which depend on the video rankings. Still, using keyword tools or professional help, you can optimize YouTube videos for search and steadily increase your traffic and video rankings.
#3 YouTube Search Reports
Let’s stop by one of the Traffic Sources – YouTube search. To see the YouTube search reports, head over to the Traffic Sources tab. You will see a number of search terms that viewers typed into the search to find your video. Not specifically yours, but which has led to your video as well.
If a certain video stands out for the number of views from multiple search terms, a smart way to move is to create a series of same-topic videos. Such videos can later be tied into a playlist with more detailed information than a single video could produce.
The search algorithm pays specific attention to the keywords used in a video, its title, description, and tags. In determining which video to show up in results, YouTube looks for a match between a user’s search terms and a video. Learn more about YouTube search and discovery algorithm. We suggest you use a time-tested YouTube Tag Generator to find the right keywords for your video.
YouTube Engagement Metrics – Video Performance
Looking into the most important YouTube engagement metrics, video performance could not be more important. These 5 metrics may seem easy and intuitive, but they tell how a video is received by the viewers.
#4 The Number of Views
An interesting fact is the more views you get, the lower engagement ratio is.
If you are still unsure what YouTube engagement is, here is a simple formula for you to calculate your video’s engagement.
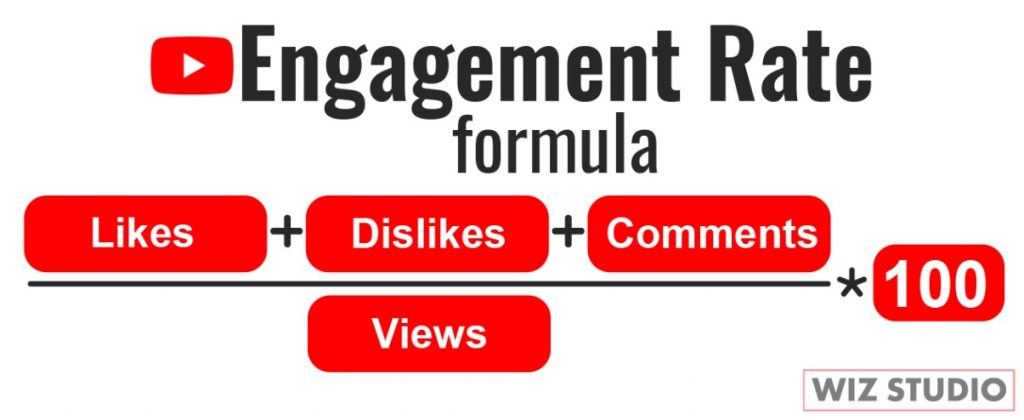
In other words, no matter how good a video is, there always would be people who view but leave no likes or dislikes. If you want to track the engagement rate for several videos using tools like YouTube Engagement Calculator saves time and provides accurate data.
It allows you to get engagement insights from any video on YouTube. All you have to do is to copy-paste a video link into the search bar. The algorithm then goes back to the platform, grabs a video, and checks not only the number of video views, likes, or comments, but calculates ratios.
📌 Quick Tip For boosting video views check out YouTube Shorts: 15 Questions You Want to Know Answers For. YouTube Shorts is the newly introduced short-form mobile video feature (still in beta version) which quickly became one of the most controversial trends on YouTube. We’ll discuss what YouTube Shorts are, and how can they help new and established creators grow views and subscribers.
#5 Average View Duration
The average view duration records for how long viewers watched a video (also known as audience retention). One of the most insightful YouTube engagement metrics, average view duration helps find the quality problem within a video.
If you think of creating a playlist, or a series of videos explaining similar topics in detail, this metric could help you see when viewers lost their interest and closed the video, or switched to another one. Sometimes a simple trick of transition effect or a relevant YouTube card can increase the average view duration.
Better retention in turn rewards with better search rankings, more YouTube suggestions, and hence, more views and engaged viewers.
To see what your average view duration is head over to YouTube Analytics, tap on the Overview tab or on the Engagement tab. Scroll to see your audience retention curve. Better retention converts into more watch time.
#6 Video Subscribers
If you are looking only at the number of channel subscribers, you’ve been getting only half of your metrics as a YouTuber. While, viewer subscriptions can vary from video to video, and not necessarily signals that one video is better than the other.
Yet, it is best if every video brings in new subscribers. More engaged subscribers guarantee stable views growth, watch time, and subscriptions. Every time you upload a video, your channel subscribers get notified. Of course, subscription does not mean a user would go and check your upload. Unless you promise value videos tailored for their needs.
Seeing who is subscribing will help multiply your efforts for videos that caught audience interest. You will see a bit more on subscribers down below among our engagement growth metrics.
#7 Number of Likes, Dislikes, Comments
Becoming a popular creator on YouTube is not just about the views, but rather engagement. It is common to see small channels have a good number of views, likes, dislikes, and comments.
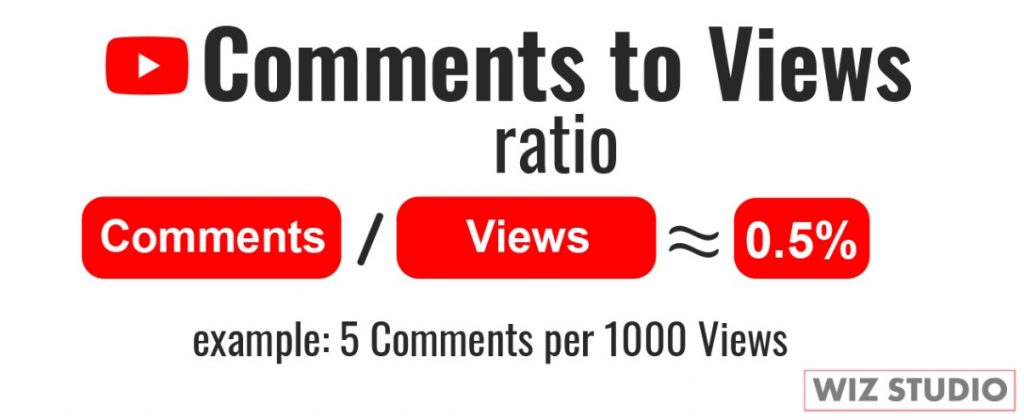
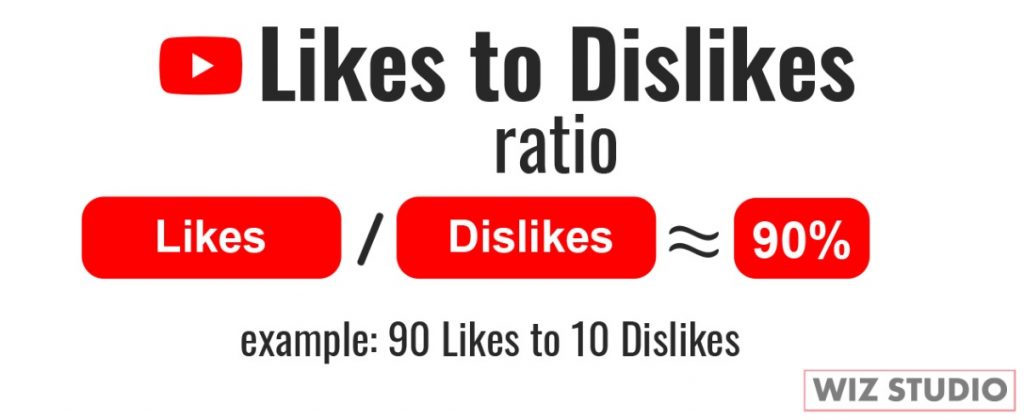
Looking into YouTube engagement metrics, the likes to views ratio, comments to views ratio, and likes to dislikes ratio say a lot about video’s performance.
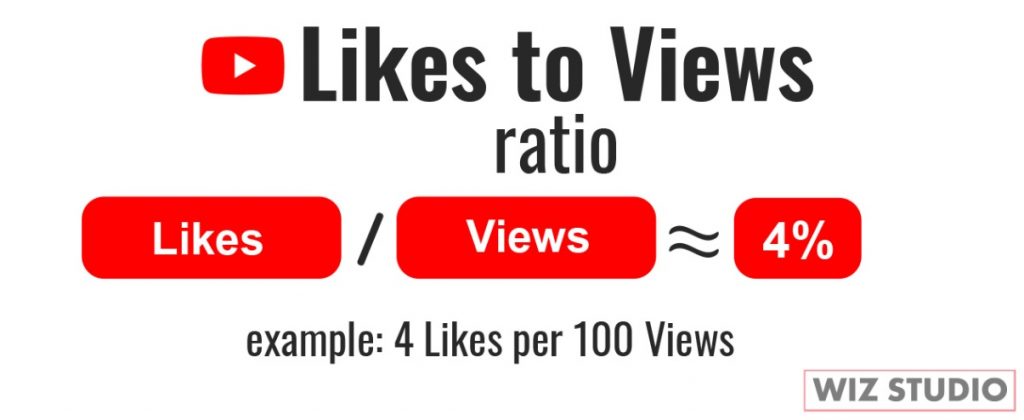
Typically, the likes to views ratio on YouTube is 4 likes per 100 views, or 4% if that is easier to remember. Significantly less likes indicate little engagement except for separate videos with millions of views. YouTubers say a typical comments to views ratio is 0.5% or 5 comments/1000 views. Naturally, if users find it hard to hit the like button, spotting a comment seems harder.
YouTube likes to dislikes ratio is about 90%, meaning for every 90 likes, there is 1 dislike. This however, depends on the niche you are in. For the music category, for example, it is common to see 100% likes to dislikes ratio alongside 30%. That is because music is up to the taste of its listeners.
If you want a simple checking tool to track your video engagement, and these ratios altogether, you could try YouTube Engagement Calculator from WizStudio. A high-speed engagement checker tool quickly brings up the estimates. It is free and requires no signup, download, or installs.
#8 Video Watch Time and Re-watches
Video watch time is the total number of minutes people spent watching your video since its upload. Generally the more views a video gets the more watch time it has. But here is the tricky part, smaller channels with a few views could still have decent watch time. How come?
This all depends on both the quality of your video and its duration. Clearly, longer videos with interesting content and controversial introductions perform better in watch time. The platform itself has admitted that watch time is one of the critical YouTube engagement metrics to know.
“Watch time is a key success metric on YouTube – videos are ranked by how much watch time they have and videos with higher watch times are likely to show up higher in search results and recommendations.”
Re-watches can be seen through the absolute audience retention graph, where they are marked as green spikes. They indicate specific parts of a video that users rewatched or a video as a whole. Check out this post explaining when and how YouTube counts the views.
YouTube Engagement Metrics – Growth Insights
Once you have data from video performance and audience insights, it is time for growth insights. Growth insights are key YouTube engagement metrics that allow to track channel growth in terms of watch time, views, subscribers, etc.
#9 Subscribers to Views Ratio
A slightly different but still important YouTube Engagement metrics is views to subscribers ratio.
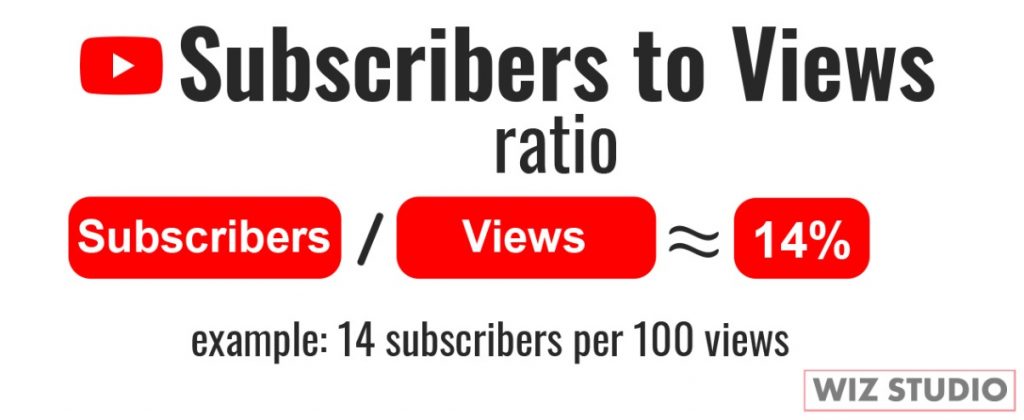
Typically, subscribers make up 12- 15% of the overall number of views. Speaking of views to subscribers ratio, it is 100:15.
Meaning that for every 100 views, 12-15 views come from channel subscribers. Now, imagine you have 1 million subscribers; what number of views could you expect?
Around 140 000 views could come from channel subscriptions alone.
Just like video views, growing number of subscribers imply the right content, interesting pitch, better discoverability, and higher rankings and channel authority.
What’s more, a minimum of 1000 subscribers is required to apply for monetization on YouTube through its Partner Program. If you are struggling to gain channel subscriptions, you can buy YouTube subscribers to get a head start in your journey.
#10 Cards and Playlist Reports
If you are on YouTube for some time, you must have used YouTube cards, End-Screen Cards, and Playlists already. Well, keep using them for higher engagement and channel growth.
YouTube suggests looking up at cards and playlists reports as a piece of critical YouTube engagement metrics. Logging into YouTube Analytics dashboard under Engagement tab, you will find your best performing videos, playlists, and likes vs dislikes reports.
Adding the end-screen cards to relevant videos increases your chances of keeping viewers inside your channel, which boosts your watch time, views count, retention, and rankings. Commonly used within a video’s duration, YouTube cards have the same goal as the end-screen cards.
All the same, YouTube Playlists made up of similar videos tied together for a more in-depth knowledge around a certain subject or case. Top cards reports display card impressions and clicks. From there you know if a video’s title and thumbnail was catchy enough to make users click, and its content – to keep watching.
Wrapping This Up
There are dozens of key YouTube engagement metrics YouTubers keep track of. Of them, only a handful gives the insights you could act on. Based on the data creators get from the metrics, we’ve conditionally grouped all metrics into Audience, Performance, and Growth insights.
While factually any piece of information could help create content better suited for your audience, these 10 must-know engagement metrics are easy to track, understand, and act up on.
What are your top 10 engagement metrics for 2021? Share your thoughts and experiences in the comments below.


You May Also Like